<img height="1" width="1" style="display:none;" alt="" src="https://dc.ads.linkedin.com/collect/?pid=463401&amp;fmt=gif">

CBEMA Graphs Revealed

Category: ProVision, Revolution, Power Quality, Analyzing Waveforms, Guardian, Voltage

CBEMA Graphs Revealed

CBEMA Graphs Revealed_02

Read how to use CBEMA graphs to provide a visual of a system's voltage stability.


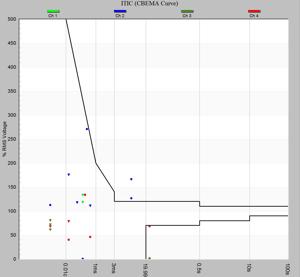
CBEMA data captured in a recording can be displayed in both graph and table form in PMI’s Provision data analysis software. This whitepaper will describe the details of the CBEMA data and how the data values relate to the graphed points.


This Whitepaper Includes:

  • CBEMA Voltage Events
  • Instantaneous Voltage Versus RMS Voltage
  • Provision's CBEMA Graph

Download White Paper Here